One token to corrupt them all: a vLLM debugging tale

TL;DR
While working on a new Jamba model, we noticed it would generate complete gibberish, but just once out of every thousand prompts. Finding and solving the bug sent us deep into the heart of vLLM, eventually touching on how its scheduler interacts with different model architectures. In addition to sharing our fix below, we also share the lessons we learned along the way about debugging a massive codebase like vLLM. We hope this detailed walkthrough makes your next vLLM debugging session a little less daunting.
The problem: gibberish in the haystack
At AI21 Labs, we build and train our own Jamba series of LLMs in-house from scratch. While working on Jamba Reasoning 3B, we noticed something concerning in our reinforcement learning (RL) training pipeline: Our model would occasionally generate complete gibberish. Not even subtle degradation. Just pure nonsense.
We caught it by monitoring max logprobs across generations. Logprobs measure model confidence – values closer to 0 indicate high certainty. Normally, bad generations come with low confidence. But our gibberish had high confidence scores. The model was confidently wrong, signaling something deeply broken rather than just poor output quality.
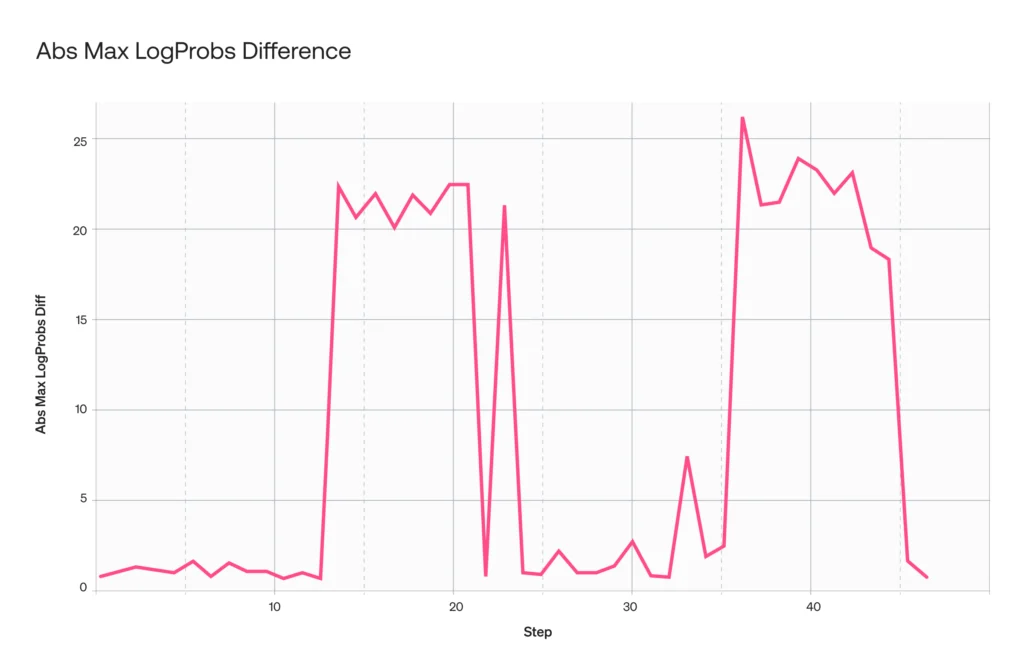
It was clear the bug wasn’t coming from the model: The same checkpoints worked perfectly with Hugging Face’s transformers, the issue only appeared under specific runtime conditions, and it occurred sporadically after hundreds of requests rather than consistently from the start. This pattern pointed us in the direction of vLLM and, specifically, its request scheduling and cache management.
The bug was serious enough that we couldn’t release the model as long as it persisted. We needed to fix it. The problem was, it would only occur sporadically – think once in a thousand prompts. Finding the needle in this haystack would require patience, methodical debugging, and eventually, instrumenting vLLM itself. You can find the result of all of this work now live in a merged fix to the vLLM project.
If you’re running inference with vLLM, whether for production serving, RL training, or evaluation pipelines, understanding how the scheduler interacts with model architectures like Mamba can save you from silent data corruption. Below, we’re sharing our step-by-step process for debugging vLLM’s massive codebase and the lessons we learned along the way.
The debug script
To systematically detect and measure these failures, we built a comparison script that would become our primary diagnostic tool throughout this investigation, as it allowed us to compare logprobs for the same token IDs; that is, instead of re-generating with transformers, we determine what transformers would have assigned to vLLM’s outputs.
Under normal conditions, vLLM and transformers should produce nearly identical logprobs for the same tokens (minor floating-point differences aside). But when vLLM generates garbage due to state corruption, the logprobs diverge dramatically: vLLM might report high confidence for a nonsense token, while transformers correctly shows it should have been extremely unlikely. This discrepancy reveals that vLLM is “confident” about tokens that make no sense in the true sequence context.
The comparison script works in two phases:
- Generate with vLLM: Send batches of prompts through vLLM, collecting the generated tokens and their logprobs.
- Verify with transformers: Run the same prompts+their generations through Hugging Face transformers, computing reference logprobs for the exact same token sequences.
# Pseudo-code for the debug comparison script

# 1. Load model
model_name = "ai21labs/AI21-Jamba-Reasoning-3B"
vllm_model = load_vllm(model_name)
hf_model = load_transformers(model_name)
batch_size = 128

# 2. Generate with vLLM and capture logprobs
prompts = ["Prompt0", "Prompt1", ...]  # 1024 prompts
all_vllm_outputs = []
for batch_idx in range(0, len(prompts), batch_size):
    batch = prompts[batch_idx : batch_idx + batch_size]
    vllm_outputs = vllm_model.generate(batch, return_logprobs=True)
    all_vllm_outputs.extend(vllm_outputs)

# 3. For each output, feed prompt + generated tokens to HF and get logits
for prompt_idx, vllm_out in enumerate(all_vllm_outputs):
      full_sequence = prompt + vllm_out.generated_tokens
      hf_logits = hf_model.forward(full_sequence)
      hf_logprobs = compute_logprobs(hf_logits)

      # 4. Compare vLLM's generation logprobs vs HF's logprobs for same sequence
      for token_idx, (v_logprob, h_logprob) in enumerate(zip(vllm_out.logprobs, hf_logprobs)):
          diff = abs(v_logprob - h_logprob)
          if diff > threshold:
              print(f"Mismatch at prompt {prompt_idx}, token {token_idx}")
              print(f"  vLLM: {v_logprob}, HF: {h_logprob}, diff: {diff}")
Reproducing the unreproducible
Our first goal sounded simple: Reproduce the issue reliably. The path there proved to be easier said than done, though.
We started with our RL dataset – thousands of prompts of varying lengths – and ran inference using ai21labs/AI21-Jamba-Reasoning-3B. We sent 1024 prompts in batches of 128, mirroring our RL setup.
Nothing. Clean generations across the board.
Implementing memory constraints
We thought about what conditions in RL might differ from our test setup. Then it struck: memory pressure.
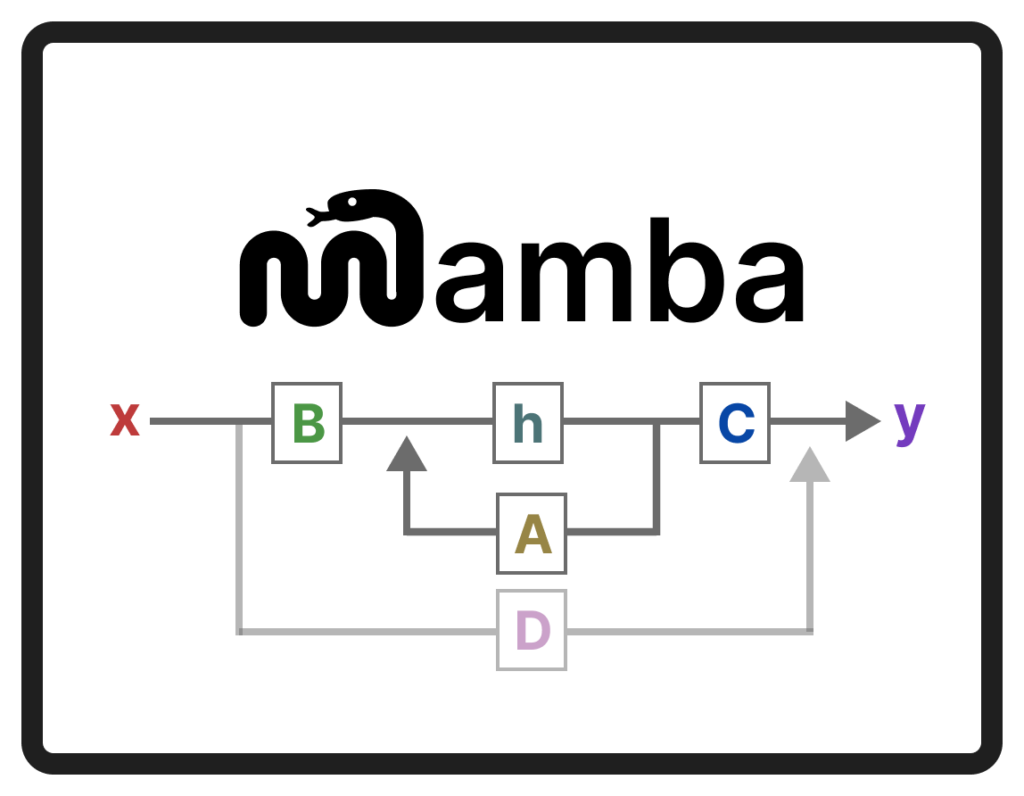
During RL training, the GPU memory is heavily utilized, meaning the SSM state cache is nearly full and cache slots get recycled aggressively. Unlike attention models where stale KV cache can’t corrupt new sequences (thanks to sequence length masking), Mamba’s SSM state is a compressed representation of an entire sequence’s history. If a new request reads stale state from a previous sequence, it’s like starting a conversation with someone else’s memories: the state accumulates recursively, so garbage at the start corrupts everything that follows.
vLLM allows control over GPU memory allocation via gpu_memory_utilization. This parameter sets the fraction of each GPU’s memory that vLLM will use for model weights, activations, and KV cache. By dropping it from 0.9 to 0.2, we forced the scheduler to operate under tight memory constraints.
llm = LLM(
    model="ai21labs/AI21-Jamba-Reasoning-3B",
    gpu_memory_utilization=0.2,
)
After rerunning the debug script, there it was: Request 854 generated gibberish.
, a82 starts for for em IN EIMT in5, an9 aals- multiplic RISM PRO
whenlickatori- rub22 RION None 1thATH CASE in2 or AND T6V9 startingenedEN
,ian [-th, a   aBPO enumerate5 and out 11EM A A, following�,AN   1Compact to...
We ran it again. Same request, same gibberish. With temperature=0, the bug was deterministic.
Now we had something to chase.
Efficiency in bug reproduction
Ideally, we would have wanted to reproduce the bug in fewer steps, such as on the first or second request, to make debugging easier. We tried using num_gpu_blocks_override for finer control over memory allocation, a parameter which allows you to directly specify the exact number of cache blocks to allocate, bypassing vLLM’s automatic calculation based on gpu_memory_utilization. While we started with very low values like 10, 15, and 40 blocks, this made vLLM crawl to a halt; too few blocks meant requests couldn’t be scheduled efficiently.
Higher values like 56 or 64 ran fine but didn’t reproduce the bug, so we needed to stick with the specific memory pressure pattern that occurred with gpu_memory_utilization=0.2. Given the time constraints, we went with this approach, although, going forward it would be worth exploring how to reproduce this bug faster.
Down the CUDA rabbit hole
Now that we could reproduce the bug, we could finally turn to the main question: Where exactly was it coming from?
Our initial hypothesis pointed to the CUDA prefill kernel, where memory bugs are notoriously subtle and don’t announce themselves with crashes. When a new request starts, the prefill kernel should initialize the SSM state from scratch. Yet if it was reading from uninitialized memory, failing to clear out stale cache entries, or writing to the wrong cache slot, that would explain the garbage outputs. The sporadic nature of the bug then made sense: Since off-by-one in block indexing means request A reads request B’s state, outcomes depend on which garbage happened to occupy that memory slot – sometimes zeros, sometimes leftover state.
We dove into the CUDA kernel, which is the heart of Mamba’s recurrence.
//  csrc/mamba/mamba_ssm/selective_scan_fwd.cu

template<typename Ktraits>
__global__ void selective_scan_fwd_kernel(SSMParamsBase params) {
    const int cache_index = cache_indices == nullptr
        ? batch_id
        : cache_indices[batch_id];

    const bool has_initial_state =
        params.has_initial_state_ptr == nullptr
            ? false
            : reinterpret_cast<bool *>(params.has_initial_state_ptr)[batch_id];

    scan_t running_prefix;
    if (chunk > 0) {
        running_prefix = smem_running_prefix[state_idx + r * MAX_DSTATE];
    } else {
        if (has_initial_state) {
     running_prefix = make_float2(1.0, float(ssm_states[state_offset]));
        } else {
            running_prefix = make_float2(1.0, 0.0);
        }
    }
}
The logic seemed sound: if has_initial_state is false (new sequence), initialize to zero. If true (continuing sequence due to chunked prefill or inner kernel chunks), load from cache. We added bounds checking, verified pointer arithmetic, and inspected SSM states for NaNs and infinities across all 28 Mamba layers. Everything looked clean.
We then used NVIDIA’s compute sanitizer tool to check for any Out of Bounds writings and memory leaks.
compute-sanitizer --tool memcheck python my_debug_script.pyNo errors: all memory accesses were in bounds. It looked like we would need to develop a new hypothesis.
Suspecting the split logic
Continuing the hunt for the source of the bug, we recalled we had recently modified how vLLM splits batches into prefill and decode requests.
#  vllm/v1/attention/backends/mamba_attn.py

def _compute_common_metadata(self, common_attn_metadata):
    num_decodes, num_prefills, num_decode_tokens, num_prefill_tokens = (
        split_decodes_and_prefills(
            common_attn_metadata,
            decode_threshold=self.reorder_batch_threshold
        )
    )

    if num_prefills > 0:
        has_initial_states_cpu = (
            num_computed_tokens_cpu[num_reqs - num_prefills : num_reqs] > 0
        )
        # ...
We spent hours inspecting the tensors here, trying to see if a request was being misclassified and assigned to the wrong group. Was a prefill request accidentally ending up in the decode batch? We were closer to the truth than we realized, but the bug was subtle and the tensor dumps were overwhelming across 28 Mamba layers and 1024 requests. We would have to continue digging.
The V0 clue
Since our previous RL workloads used vLLM’s V0 engine (the older deprecated engine architecture) without this issue, we ran the same workload on V0 to compare.
Once again: No gibberish, just perfect generations.
What could be different between model behavior with V1 and V0? We remembered an old quirk in V0: Due to a bug, Mamba1 models never actually called the decode kernels; instead, everything ran through the prefill path.
Prefill kernels must initialize the state to zero (because they handle the start of a sequence), whereas decode kernels must load state from memory (because they assume a sequence is already in progress).
For a full apples-to-apples comparison, We hacked V1 to force all requests through the prefill kernels, bypassing decode entirely. The key changes were in mamba_mixer.py:
# Hack: Force prefill path for ALL tokens
def forward_cuda(self, hidden_states: torch.Tensor, output: torch.Tensor):
    # ...

    # ORIGINAL CODE:
    # has_prefill = num_prefill_tokens > 0
    # has_decode = num_decode_tokens > 0
    #
    # if has_prefill:
    #     # ... run prefill kernel
    # if has_decode:
    #     # ... run decode kernel

    # HACK: Always run prefill, never run decode
    if True:  # was: if has_prefill
        # Run prefill kernel for ALL tokens
        conv_out_p = causal_conv1d_fn(
            hidden_states_BC,  # All tokens, not just prefill
            conv_weights,
            self.conv1d.bias,
            activation=self.activation,
            conv_states=conv_state,
            has_initial_state=has_initial_states_p,
            cache_indices=state_indices_tensor,
            query_start_loc=query_start_loc_p,
            # ...
        )
        # ... rest of prefill path

    if False:  # was: if has_decode
        # Decode path - NEVER RUNS
        pass
We also had to modify the metadata builder in mamba_attn.py to provide prefill-style metadata for all requests:
  # Force all requests through prefill metadata path
  if True:  # was: if num_prefills > 0
      query_start_loc_p = common_attn_metadata.query_start_loc[:num_reqs]
      has_initial_states_cpu = common_attn_metadata.num_computed_tokens_cpu[:num_reqs] > 0
      has_initial_states_p = has_initial_states_cpu.to(
          common_attn_metadata.query_start_loc.device
      )
      # ...
The gibberish disappeared. Every generation was clean.
We thought we’d solved it: The bug must be in the decode kernels! We eagerly got to work diving into the Triton decode kernels, adding prints, checking pointer calculations, and verifying memory access patterns.
But nothing. The decode kernels were fine. Back to square one.
The debugging wall
To summarize, at this point we had run through a long checklist:
compute-sanitizershowed no memory errors- CUDA kernel checks passed
- SSM states were clean
- Split logic looked correct
- Decode math was correct
The issue was deterministic but only appeared after hundreds of requests had been processed. We couldn’t easily reproduce it on the first few requests despite trying various num_gpu_blocks_override values.
This timing was crucial. It meant the bug wasn’t in the model initialization or the first pass through the SSM layers, it was something about how vLLM managed requests over time. The scheduler, the cache recycling logic, or the batch composition had to be involved. We needed to narrow down where in the pipeline things went wrong.
The missing piece: request identity
We’d established that the problem wasn’t what the kernels were doing; rather, it was when they were being called and for which requests.
But here’s the challenge with debugging vLLM: by the time tensors reach the model layers, all request identity is lost. The scheduler works with request IDs, but the model sees only batched tensors and indices. Request 854 was just… somewhere in those tensors.
We needed to thread request IDs through the entire forward pass so we could set a breakpoint specifically when request 854 was being processed.
Instrumenting vLLM’s forward context
vLLM uses a ForwardContext dataclass to pass metadata through the model. We added request tracking:
# vllm/forward_context.py

@dataclass
class ForwardContext:
    attn_metadata: dict[str, AttentionMetadata]
    virtual_engine: int
    dp_metadata: DPMetadata | None = None
    # ... existing fields ...

    # NEW: Request IDs for debugging
    req_ids: list[str] | None = None
Then we updated set_forward_context to accept and propagate request IDs:
# vllm/forward_context.py

@contextmanager
def set_forward_context(
    attn_metadata: Any,
    vllm_config: VllmConfig,
    # ... existing params ...
    req_ids: list[str] | None = None,  # NEW
):
    forward_context = create_forward_context(
        attn_metadata,
        vllm_config,
        # ... existing args ...
        req_ids=req_ids,
    )
    with override_forward_context(forward_context):
        yield
In the model runner, we passed the request IDs through:
# vllm/v1/worker/gpu_model_runner.py

with set_forward_context(
    attn_metadata,
    self.vllm_config,
    num_tokens=num_tokens_padded,
    cudagraph_runtime_mode=cudagraph_mode,
    req_ids=self.input_batch.req_ids,  # Thread request IDs through
):
    model_output = self._model_forward(...)
Finally, in the Mamba mixer layer, we could see exactly which requests were being processed:
# vllm/model_executor/layers/mamba/mamba_mixer.py

def forward_cuda(self, hidden_states: torch.Tensor, output: torch.Tensor):
    forward_context = get_forward_context()
    attn_metadata = forward_context.attn_metadata[self.prefix]

    # Now I can see exactly what's happening
    if forward_context.req_ids is not None:
        num_decodes = attn_metadata.num_decode_tokens
        num_prefills = attn_metadata.num_prefills

        decode_req_ids = forward_context.req_ids[:num_decodes]
        prefill_req_ids = forward_context.req_ids[num_decodes:num_decodes + num_prefills]

        # Set breakpoint when our problematic request appears
        if "854" in forward_context.req_ids:
            breakpoint()  # NOW we can inspect!
The revelation
With request tracking in place, we set a breakpoint and waited for request 854 to appear.
When it hit, we inspected the batch composition. The req_ids showed request 854 at index 86:
#  vllm/v1/attention/backends/utils.py
input_batch.req_ids = [
    ...
    '845-a1a7ebcb',  # index 77
    '846-9218e1e3',  # index 78
    ...
    '852-b1e447b5',  # index 84
    '853-bb41acbe',  # index 85
    '854-a83e1fd2',  # index 86 - our culprit
]
We printed the is_decode classification array:
is_decode = array([
    True,  True,  True,  ...  True,   # indices 0-53: regular decodes
    False, False, False, ... False,   # indices 54-85: prefills
    True                              # index 86: request 854 - marked as DECODE!
])
Request 854 was classified as a decode on its very first appearance. But why? We checked the num_scheduled_tokens array:
num_scheduled_tokens_np = array([
    1, 1, 1, ... 1,                    # indices 0-53: decodes (1 token each)
    83, 181, 181, 469, 1343, ...       # indices 54-85: prefills (many tokens)
    1                                  # index 86: request 854 - only 1 token!
])
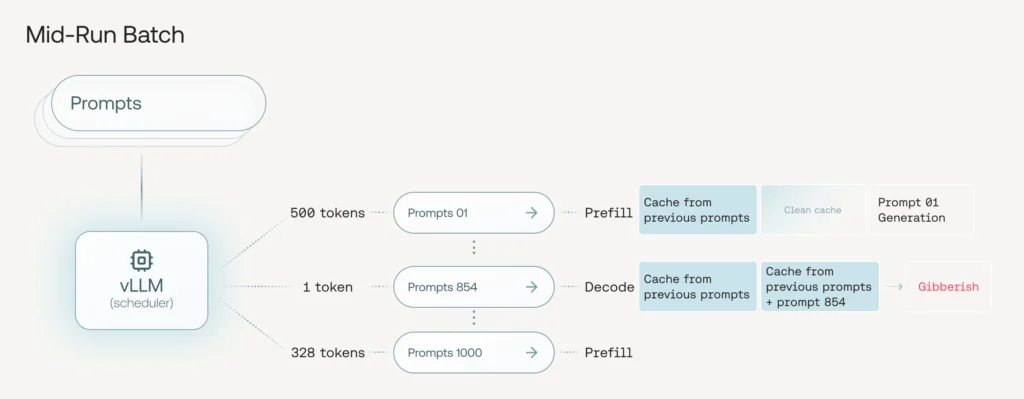
The scheduler had run out of token budget. Request 854, a brand new prompt, was allocated just 1 token. And the classification logic at the time was:
is_decode = num_scheduled_tokens == 1One token scheduled = must be a decode, right? Wrong. Request 854 had num_computed_tokens=0 – it was a new request that had never been processed before. It should have been classified as a prefill, but the single-token allocation made it look like a decode.
#  vllm/v1/attention/backends/utils.py
def reorder_batch_to_split_decodes_and_prefills(...):
		...
		is_decode = num_scheduled_tokens_np <= decode_threshold # BUG
		is_extend = (~is_decode) & (num_computed_tokens_np > 0)
		is_prefill = (~is_decode) & (num_computed_tokens_np == 0)
A request with 1 scheduled token was classified as “decode” regardless of whether it was new or continuing. But request 854 was new; it had never been processed before.
The root cause
Here’s the complete chain of failure:
- The scheduler’s token budget was nearly exhausted (due to low
gpu_memory_utilization) - New request 854 arrived with 475 tokens to process
- Scheduler could only allocate 1 token to it
- 1 token → classified as “decode” by the reorder logic
- Decode path assumes existing state → reads SSM state from cache
- But request 854’s cache slot contained garbage from a previous, completed request
- The model generated based on this corrupted state
- Subsequent iterations continued with the corrupted state
Why transformers don’t have this problem
You might wonder: Wouldn’t the same bug affect transformer models with KV caches? The answer is no, and the reason is fundamental to how attention works versus SSM recurrence.
Transformer attention uses sequence length masking. When FlashAttention runs, it receives a seqused_k tensor that specifies exactly how many valid KV tokens exist for each request:
Attention: Write-then-Read
# FlashAttention forward (vllm/v1/attention/backends/flash_attn.py)

# Step 1: WRITE current token's K,V to cache
reshape_and_cache_flash(key, value, key_cache, value_cache, slot_mapping, ...)

# Step 2: READ from cache for attention computation
flash_attn_varlen_func(
    q=query,
    k=key_cache,   # includes freshly written K
    v=value_cache, # includes freshly written V
    seqused_k=seq_lens,  # bounds attention to valid positions
    ...
)
Even if a new request is misclassified as “decode”, its own K,V are written to the cache before attention reads from it. The stale data at position 0 is overwritten first.
Mamba has no such boundary. The SSM state is loaded as a complete vector:
# Mamba selective_state_update kernel (mamba_ssm.py)

# Step 1: READ state from cache (assumes continuing a sequence)
state = tl.load(state_ptrs, ...)

# Step 2: Compute with loaded state
state = state * dA + dB * x

# Step 3: WRITE updated state back to cache
tl.store(dst_state_ptrs, state, ...)
When a new request is misclassified as “decode”, it reads stale state from a previous request before writing anything. The computation is corrupted from the start.
This is why the prefill kernel worked correctly for Mamba in one of the tests I described above – it explicitly initializes the state to zero via the has_initial_state flag. The decode kernel assumes the state is already valid.
The fix
The fix was simple once the root cause was clear. We changed the classification logic to consider whether a request is truly new:
#  vllm/v1/attention/backends/utils.py

def reorder_batch_to_split_decodes_and_prefills(...):
    # NEW: A request is prefill if it has no computed tokens (it's new)
    is_prefill = num_computed_tokens_np == 0
    # Decode/extend only applies to requests that already have context
    is_decode = (num_scheduled_tokens_np <= decode_threshold) & (~is_prefill)
    is_extend = (num_scheduled_tokens_np > decode_threshold) & (~is_prefill)
Now, a request with num_computed_tokens == 0 is always classified as prefill, regardless of how many tokens are scheduled. Only requests that already have computed tokens can be classified as decode.
Lessons learned
- Memory pressure reveals bugs that don’t manifest under ideal conditions. Test with constrained resources.
- Determinism is your friend. Once I had a reproducible case with temperature=0, debugging became tractable.
- Instrument your systems. Adding request ID tracking to vLLM’s forward pass was a small change that made the bug immediately visible. Sometimes the best debugging tool is one you build yourself.
- Trust but verify. The decode kernels were mathematically correct, yet they were just being called at the wrong time, for the wrong requests.
- Near misses matter. When I inspected the split logic, I was looking at the right area but couldn’t see the bug in the wall of tensor data. The request ID instrumentation gave me the precise visibility I needed.
Final note
The lessons from this debugging journey extend beyond Mamba. Whether you’re working with attention models, MoEs, or any other architecture, the core principles remain: reproduce under realistic conditions, instrument critical paths, compare logprobs against a known-good baseline (like HuggingFace’s transformers), and don’t fixate on your first hypothesis – the bug might be in a completely different layer than you expect. We hope this detailed walkthrough makes your next vLLM debugging session a little less daunting.
If you are running Mamba models in vLLM, make sure you are using version v0.14.0 with this fix or ensure that new requests always start with prefill initialization.
Find the full fix merged here: https://github.com/vllm-project/vllm/pull/32118